Step 1. Coverage-based analysis
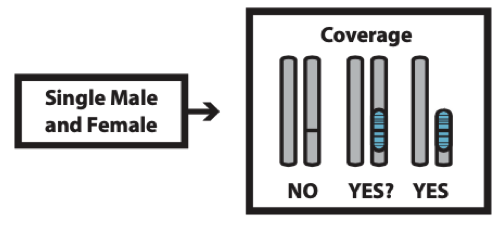
To determine if there are large sex-specific regions present in your species of interest, a coverage-based analysis is first carried out.
Running DifCover
DifCover (https://github.com/timnat/DifCover) requires only a single male and single female bam file aligned to a reference genome.
Example DifCover command with 1 male (SRR8585998_1.fastq.bam) versus 1 female (SRR8585999_1.fastq.bam).
bash run_difcover.sh SRR8585998_1.fastq.bam SRR8585999_1.fastq.bam 1 >> difCov_Male98_over_Female99_outerr.txt 2>&1
Note that you will need to modify run_difcover.sh to have a proper path for FOLDER_PATH on your system, and the 1 is the library-specific Adjustment Coefficient (AC) to account for differences in sequencing depth between samples. The correct AC value can be determined by taking the ratio of modal depths for the samples of interest through samtools stats as follows:
chmod u+rwx samtools_Modaldepth.sh
for file in $(ls *q.bam); do ./samtools_Modaldepth.sh $file; done
Once you have a modal depth for each sample you are interested in, AC is (modal coverage of sample 2 / modal coverage of sample 1). Of note, I have found that although this works well for some samples, others report a modal depth of 1, which is not helpful for determining AC. In these cases, I have have mixed success simply using the ratio of the bam file sizes for AC. This can be dialed in after the analysis as well by plotting and examining the center of the distribution (which should lie at 0 for autosomes if AC is properly set).
Analyzing DifCover Results
An example output file sample1_sample2.ratio_per_w_CC0_a10_A219_b10_B240_v1000_l500.log2adj_1.DNAcopyout is included in the GitHub repository alongside the R script Fugu_M98_F99_DifCover.R used to generate the figures in the main body of the paper. Given that fugu has only a single SNP that is fixed between males and females, coverage does not produce any outlier windows for this species.
As an example of a species that does exhibit significant differences in depth, the DifCover plot for chicken is also provided below. The code for chicken can be found in Supplemental Code on GitHub.
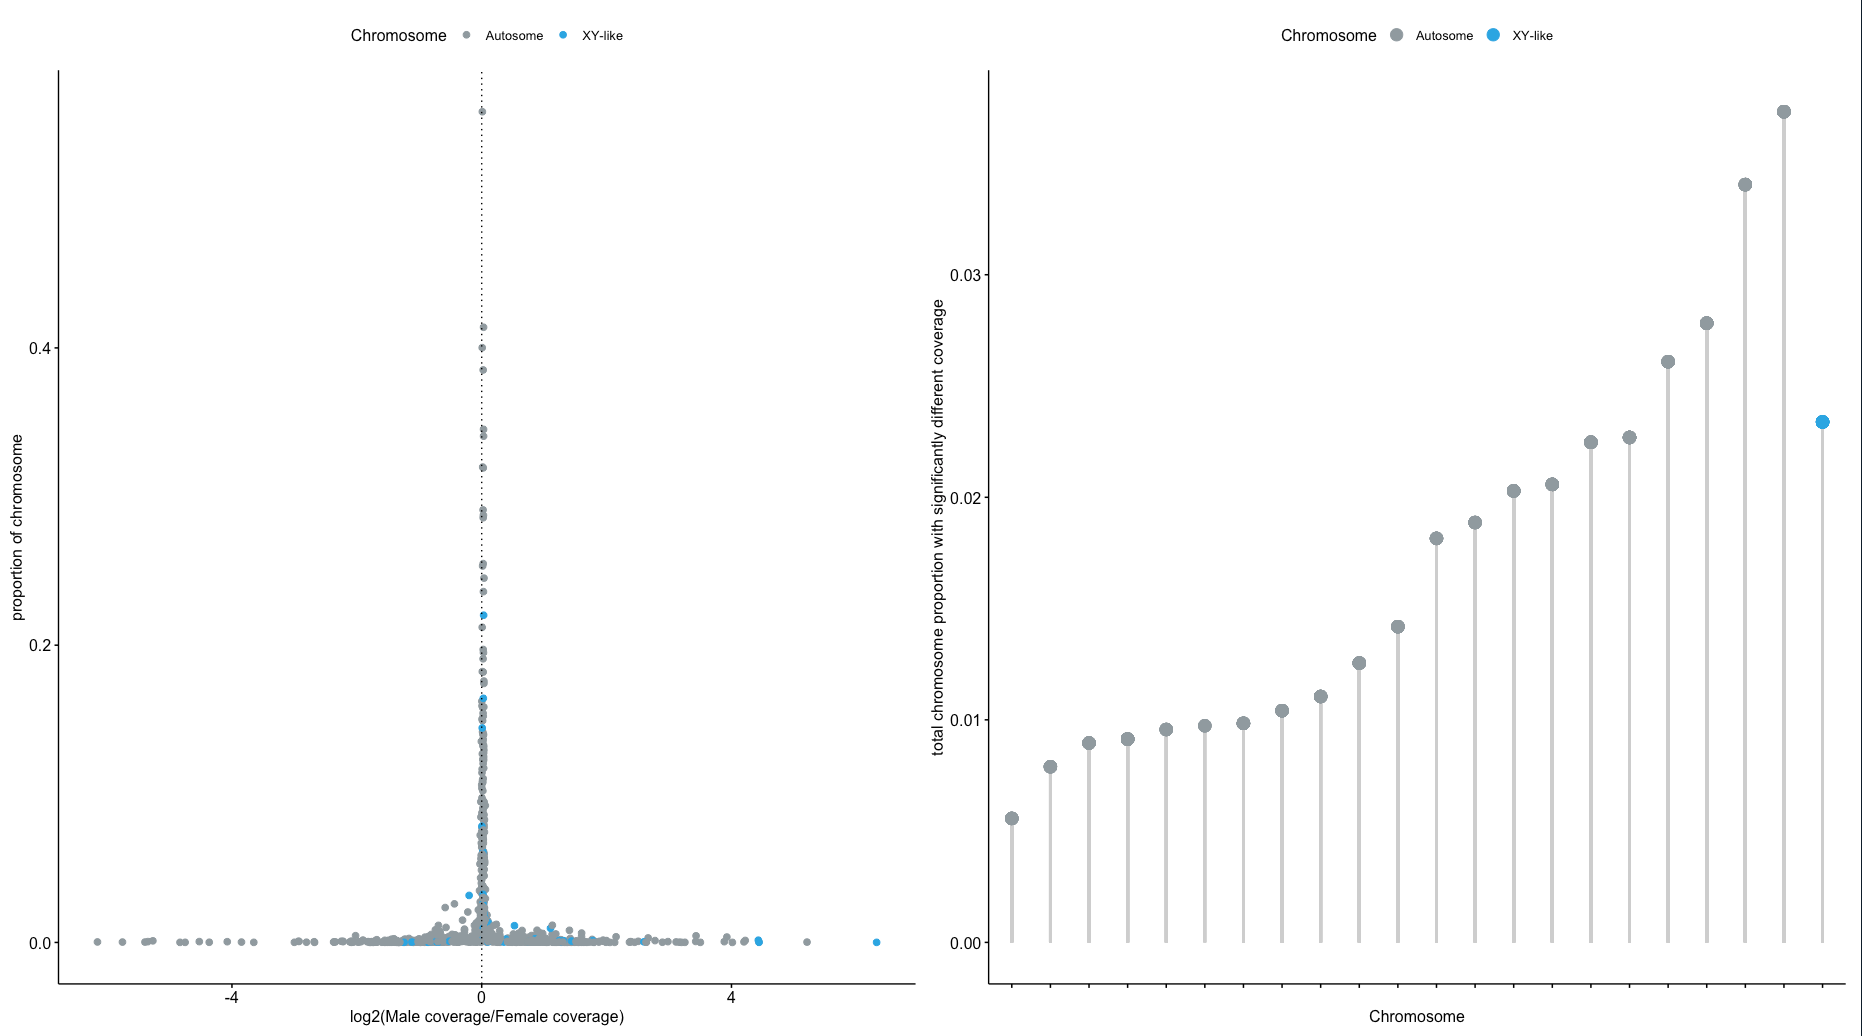
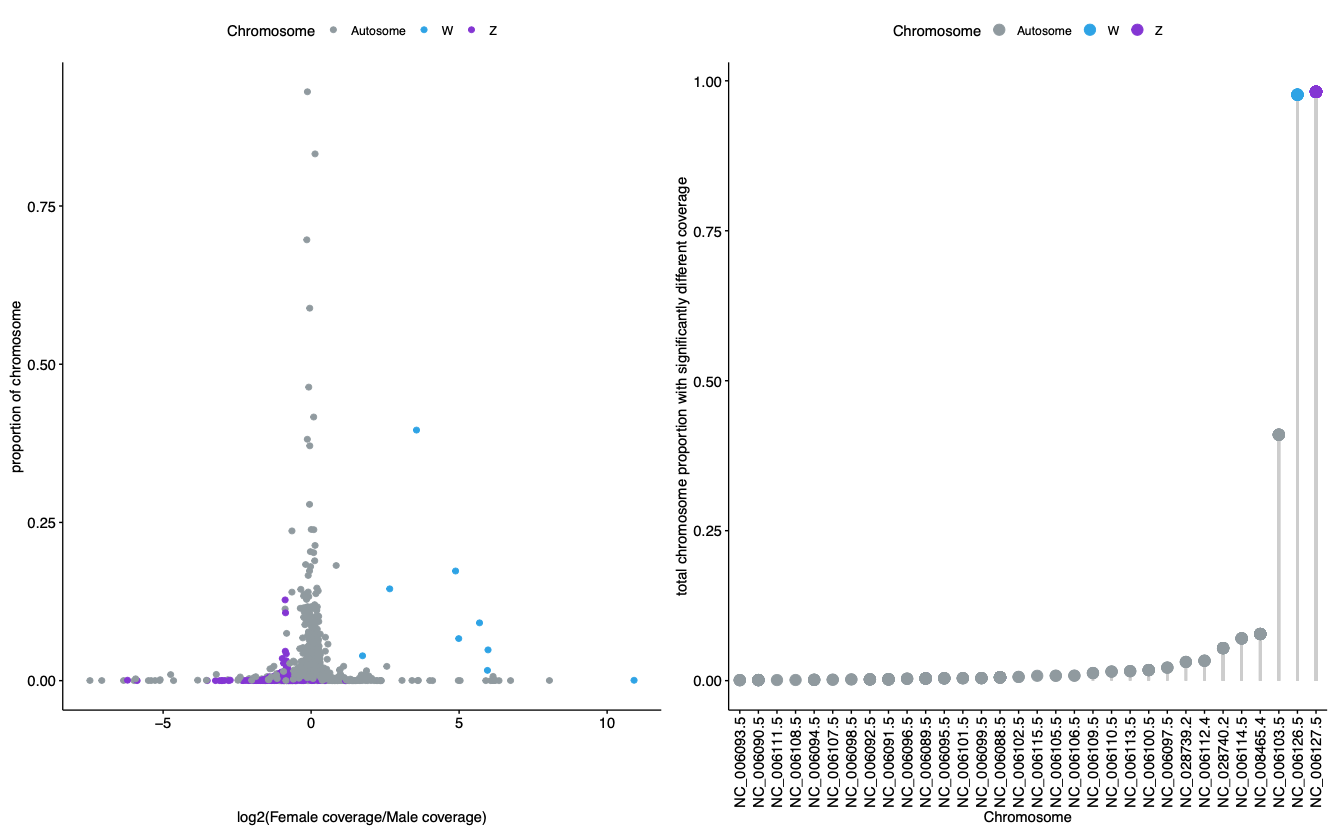
Figure 2. DifCover fails (top) to identify coverage differences between a single male and single female in the fugu, indicating that there are no large regions of recombination suppression in the fugu genome (and/or suggesting that the fugu sex determining region is very young in evolutionary time). DifCover succeeds (bottom) at identify the Z and W chromosomes in chicken using only information on depth of coverage between a single male and single female